


As we are observing the world population growth, we can see that its progress is very rapid. Many researchers are trying to predict what this rate will be like in the future and what consequences it will lead to. On the other hand, few researchers take time to wonder what this rapid growth tells us about the size of the population in the past.
Using mathematics, I interpolated the historic data of the size of the world population using exponential function. Evolutionists say that mankind has been living on Earth for 200 000 years and there were 10 000 people 70 000 years ago. However, mathematic approximation shows that in 2369 BC, there were only 8 people! Amazingly, it confirms the Bible which says that God created the Earth about 4000 years before Christ and God sent the flood 1656 years after the creation, i.e. about 2344 BC. Therefore, the difference between the mathematical approximation and what God said in the Bible is only 25 years!
Mathematical model
Firstly, I will try to approximate historical world population data with the use of some mathematical function so that we will be able to predict the world’s population in the future, but at the same time, we will be able to estimate how the world’s population changed in the past. In the diagram below, I am presenting the historical data of the world’s population.
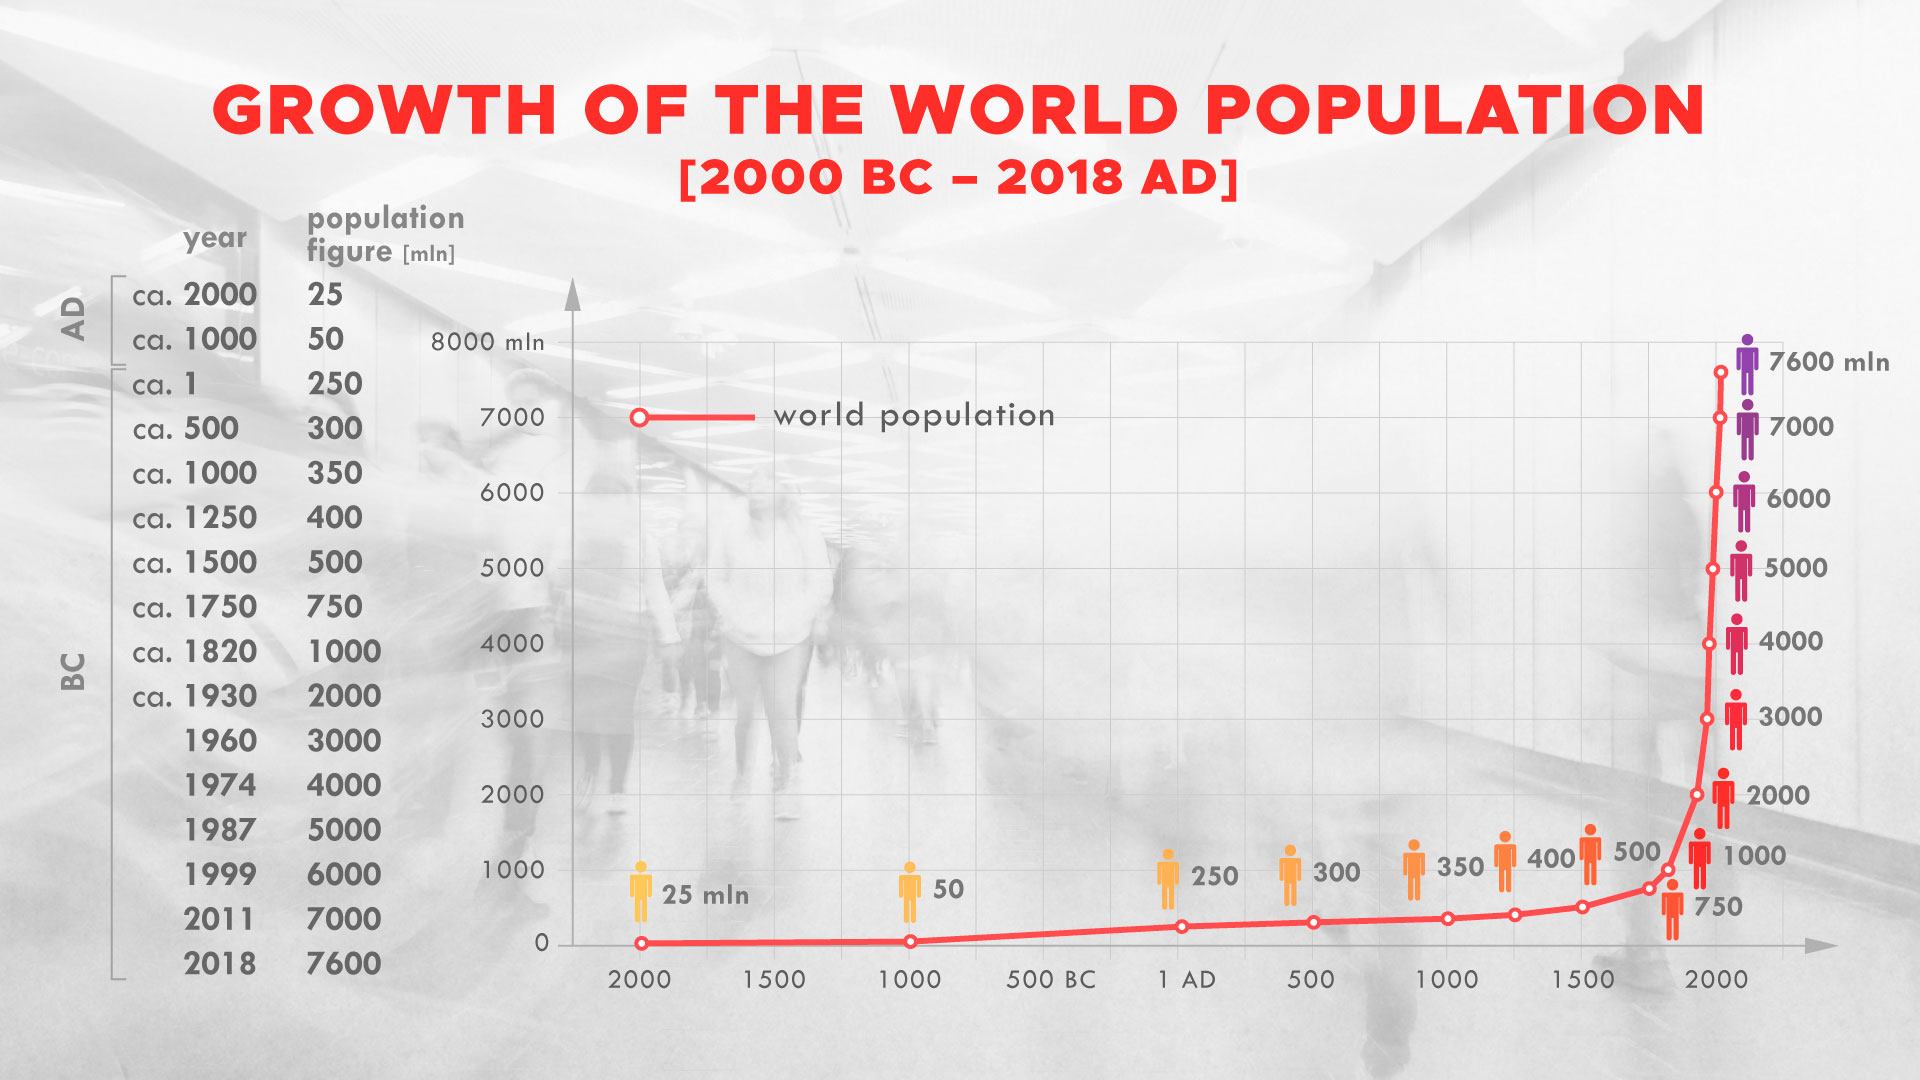
At first glance, we can see that the population grows exponentially. However, it turns out that the approximation by functions
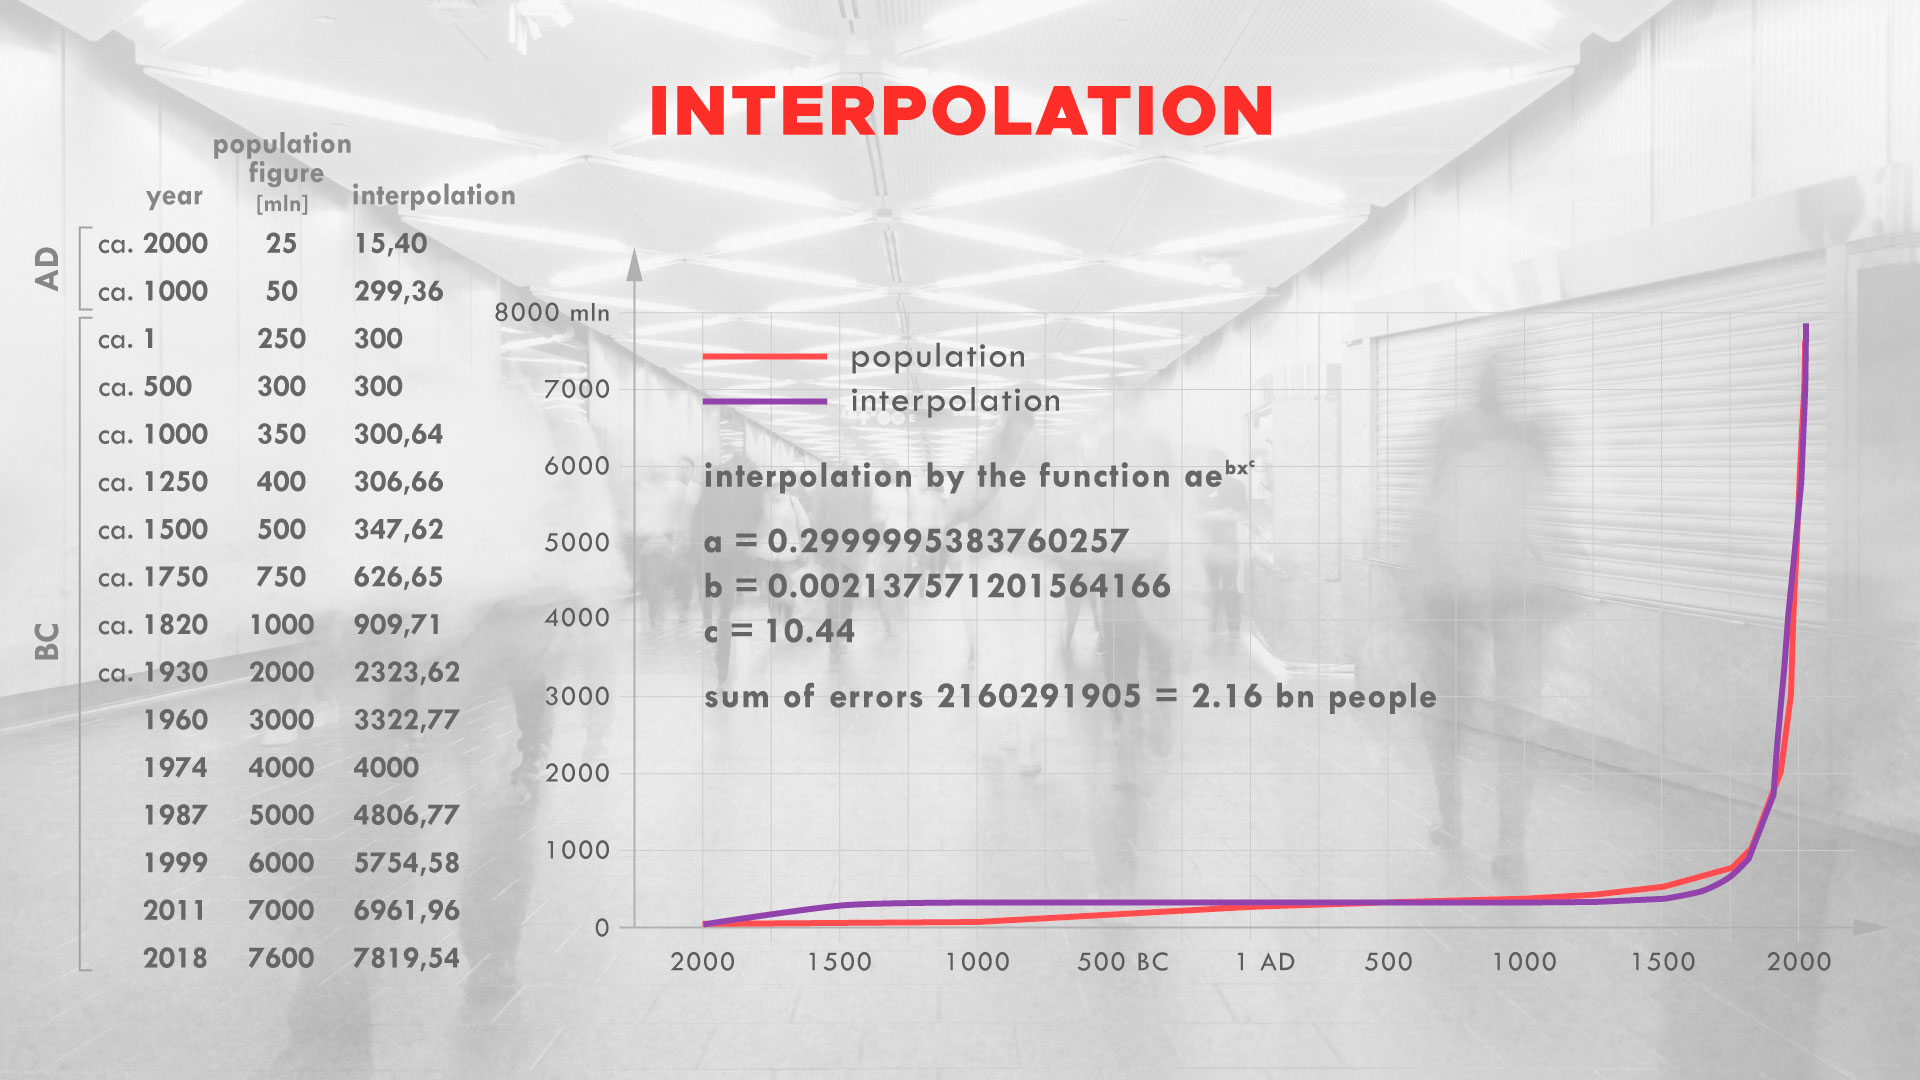
is weak, i.e. a big approximation error occurs. It is caused by the fact that the population is growing faster than this function (using this kind of approximation, in 2020 less than 3 billion people would be living on Earth. The fact is that now we have 7,8 billion). Therefore, I will use functions that can grow much faster. I will use a function
Mathematics
In this part, I will try to explain the mathematics which I used. This will be a technical paragraph, if you don’t like mathematics, please feel free to skip it.
For a family of approximating functions, I used
for real parameters a,b>0, c>1. Variable t represents time. To use this kind of function also for negative t (which corresponds to BC dates), I define
for negative t. Therefore, we have functions that grow rapidly in positive t and which tends to 0 when t goes to -∞ (times goes back to the past). Now, we have to calculate the most optimal parameters a, b, c.
The approximation algorithm is the following: I chose two nodes – two dates, in which the values of function have to be equal to historical data. For these nodes, I solve the equations and determine variables a and b, dependently of c. Next, I perform the optimization in c, testing c > 1, for which the sum of squares of errors (differences between approximation and historical dates) is the smallest. Which dates do I choose? Here, I also test all possibilities (pairs of available dates). So the algorithm is as follows: for each pair of dates I test parameter c, for this c, I obtain a and b and then, the sum of the square of errors.
This way, I obtain optimal dates (500 AD and 1974 AD) and the optimal exponent c=10.44 and parameters a and b. It turns out that historical data of the world population are best approximated by function with parameters a = 0.299, b = 0.0021. The sum of absolute values of errors is 2.2 billion people.
To avoid calculation errors, the time the unit is 1000 years, and the function values are billions of people.
The “historical” data of the size of the world population is also a problematic issue. From which point in time is this data based on historical documents, and not just on the wishes of evolutionists? The matter is debatable – it is known that Julius Caesar tried to count the population of some regions (e.g. England). During the reign of Emperor Octavian (27 BC – 14 AD), a census of the Roman Empire was carried out – then, there were around 80 million people. Therefore, I believe that data from 1 AD can be trusted. I also add data from 1000 BC and 2000 BC, although I realize that these are estimates.
Disputes regarding the adopted model and data selection are discussed in the section on criticism.
Result analysis
Now, we can examine what our function tells us about the past. Evolutionists say that man has been inhabiting the earth for about 200,000 years, and that in 70,000 BC, there were 10,000 people on Earth. How does this relate to the data determined by our approximation? We can check when our function’s value equals 8 (number of people in Noah Ark). It turns out that it happened about 2369 BC. Note, according to the Bible world is about 6000 years old – 2000 years after Christ and about 4000 before. However, Flood occurred 1656 years after the creation. And this implicates that 8 people came out from the Ark around 2344 BC. See? It turns out that our mathematical approximation confirms what the Bible says – the difference is only 25 years!
Criticism of the model
Of course, there are many issues to argue about in this model – you can criticize the choice of the form of the approximation function. Population-modeling mathematicians usually use exponential approximations, but sometimes additional modifications are made, e.g. we can study this kind of functions
and have the inflection point shifted. I also tested such models. We can also look for an approximation by the method of the least squares rather than by nodes which is what I do.
As for historical data, the overrepresentation of data from the last century is immediately noticeable, which makes it outweigh past data when calculating the sum of the squares of errors. Here, I used two modifications – I also tested the dataset in which the dates are equally spaced apart by every 500 years, and I tested the method of calculating the sum of the squared errors with weights, where the weight was the time elapsed since the last date.
However, applying all this modification, the approximation curve always converged to the value of 8 people living somewhere between 2700 BC and 2000 BC. So you can see that regardless of the model adopted, the result is always extremely distant from the 200,000 years served to us by evolutionists.
Even if we limit our study to the period in which the population grew the slowest e.g. to 1 AD – 1500 AD, (then the population increased by only 250 million people in over 1500 years), then linear regression line shows that there were 8 people on the Earth in 1522 BC, whereas exponential regression curve shows that there were 8 people on the Earth about 40 000 years BC. The last result is so distant because the curve grows very slowly (at the same time it descends very slowly, looking backward). According to that curve, there would be only 580 million people in 2020, i.e. 7,22 billion people less than there is. But even in this case, it is a difference of 160,000 years compared to the evolutionists’ hypothesis …
Population growth rate
Another approach to studying population growth is to calculate the population growth rate. It is expressed by a formula
t2 > t1 shown above are two dates and P(t) describes the size of the population in time t. The population growth rate is expressed in percentage. If for example this rate is at a some year equal to A, and in this year the population size is X, then in the next year the population will increase by A * X people.
The population growth rate is currently 1.05%, although in 1968 it was 2.08%. According to evolutionists, man has been living on earth for 200,000 years. However, if we assumed a population growth rate as low as 0.105%, which is 10 times less than it is today, then the population would double every 656 years. After 200 000 years, the population, starting from two people, today should be 2,85 * 1091 , so for every square centimeter of the earth, there would be 1,91 * 1073 people :).
If we assume the population growth rate even at such a low level as we observed in the years 1 AD – 1500 AD, that is 0,046%, then (assuming there were 2 persons 200 000 years ago) today on the earth there would be 1,76 * 1040 people, that is 2200000000000000000000000000000 times more than it is now :). If we assume evolutionist hypothesis – 2 people 200,000 years ago and 7.8 billion now, we get a population growth rate equal to 0.01%. Then the population would double every 6277 years (for the last 2,000 years the population has doubled on average every 406 years) With these hypotheses, assuming 25 million people in 2000 BC, today there would have only 39.6 million people on earth, which is not much more than in Poland today :).
For comparison, if we examine the data given by God in the Bible, i.e. 8 people about 4,400 years ago – this is the number that came out of Noah’s Ark – and then take the current number of people, we get a growth rate equal to 0.5%, which is comparable to the current one.
The evolutionists’ answer
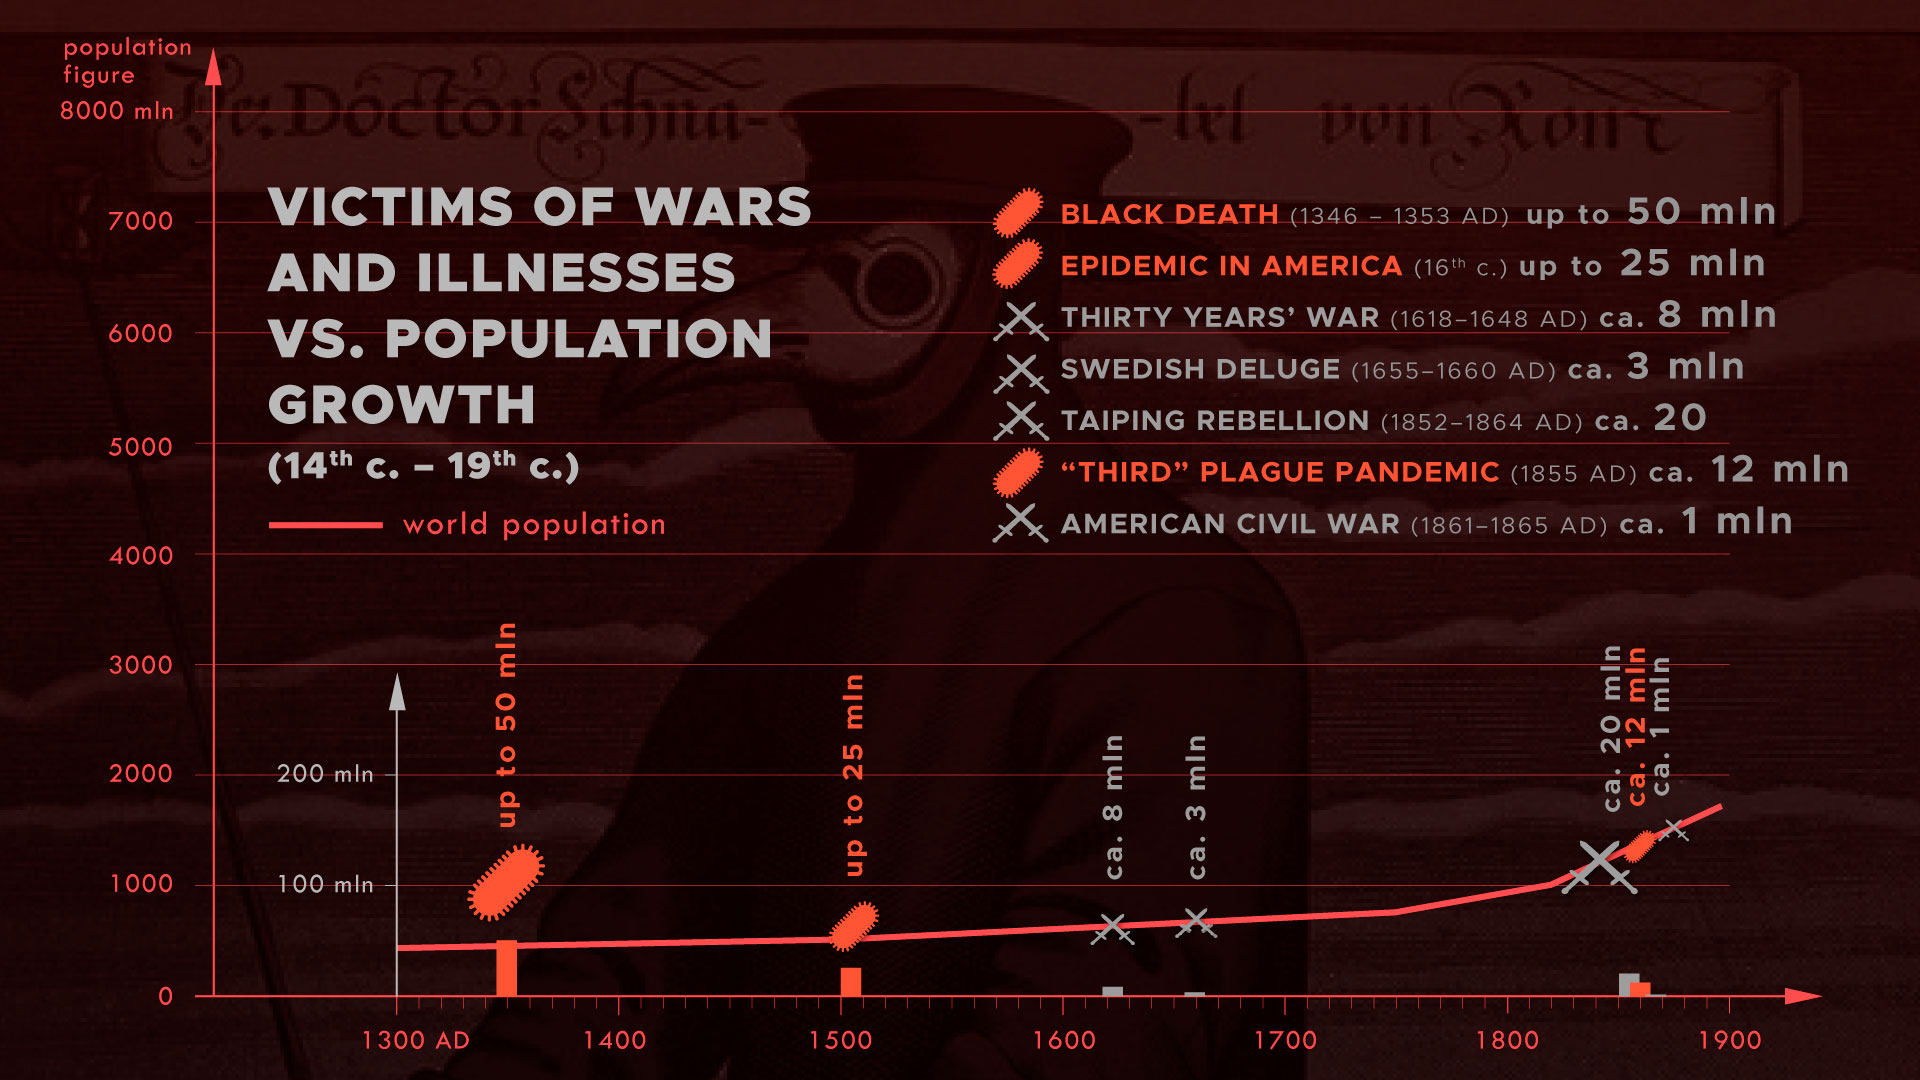
The argument that evolutionists make when confronted with such calculations is that in the past there were diseases and wars, medical care was poor and therefore the population grew very slowly or was constant.
This hypothesis should be confronted with historical data. Well, history shows that the world’s population grew at such a rate despite various epidemics and wars, and in particular despite world wars!
Here is a list of the biggest epidemics in the history of the world:
Plague of Justinian (541–544 AD) – around 25 million – 100 million casualties
Black Death (1346–1353 AD) – around 75 million – 200 million casualties
“Third” plague pandemic (1855 AD) – around 12 million casualties
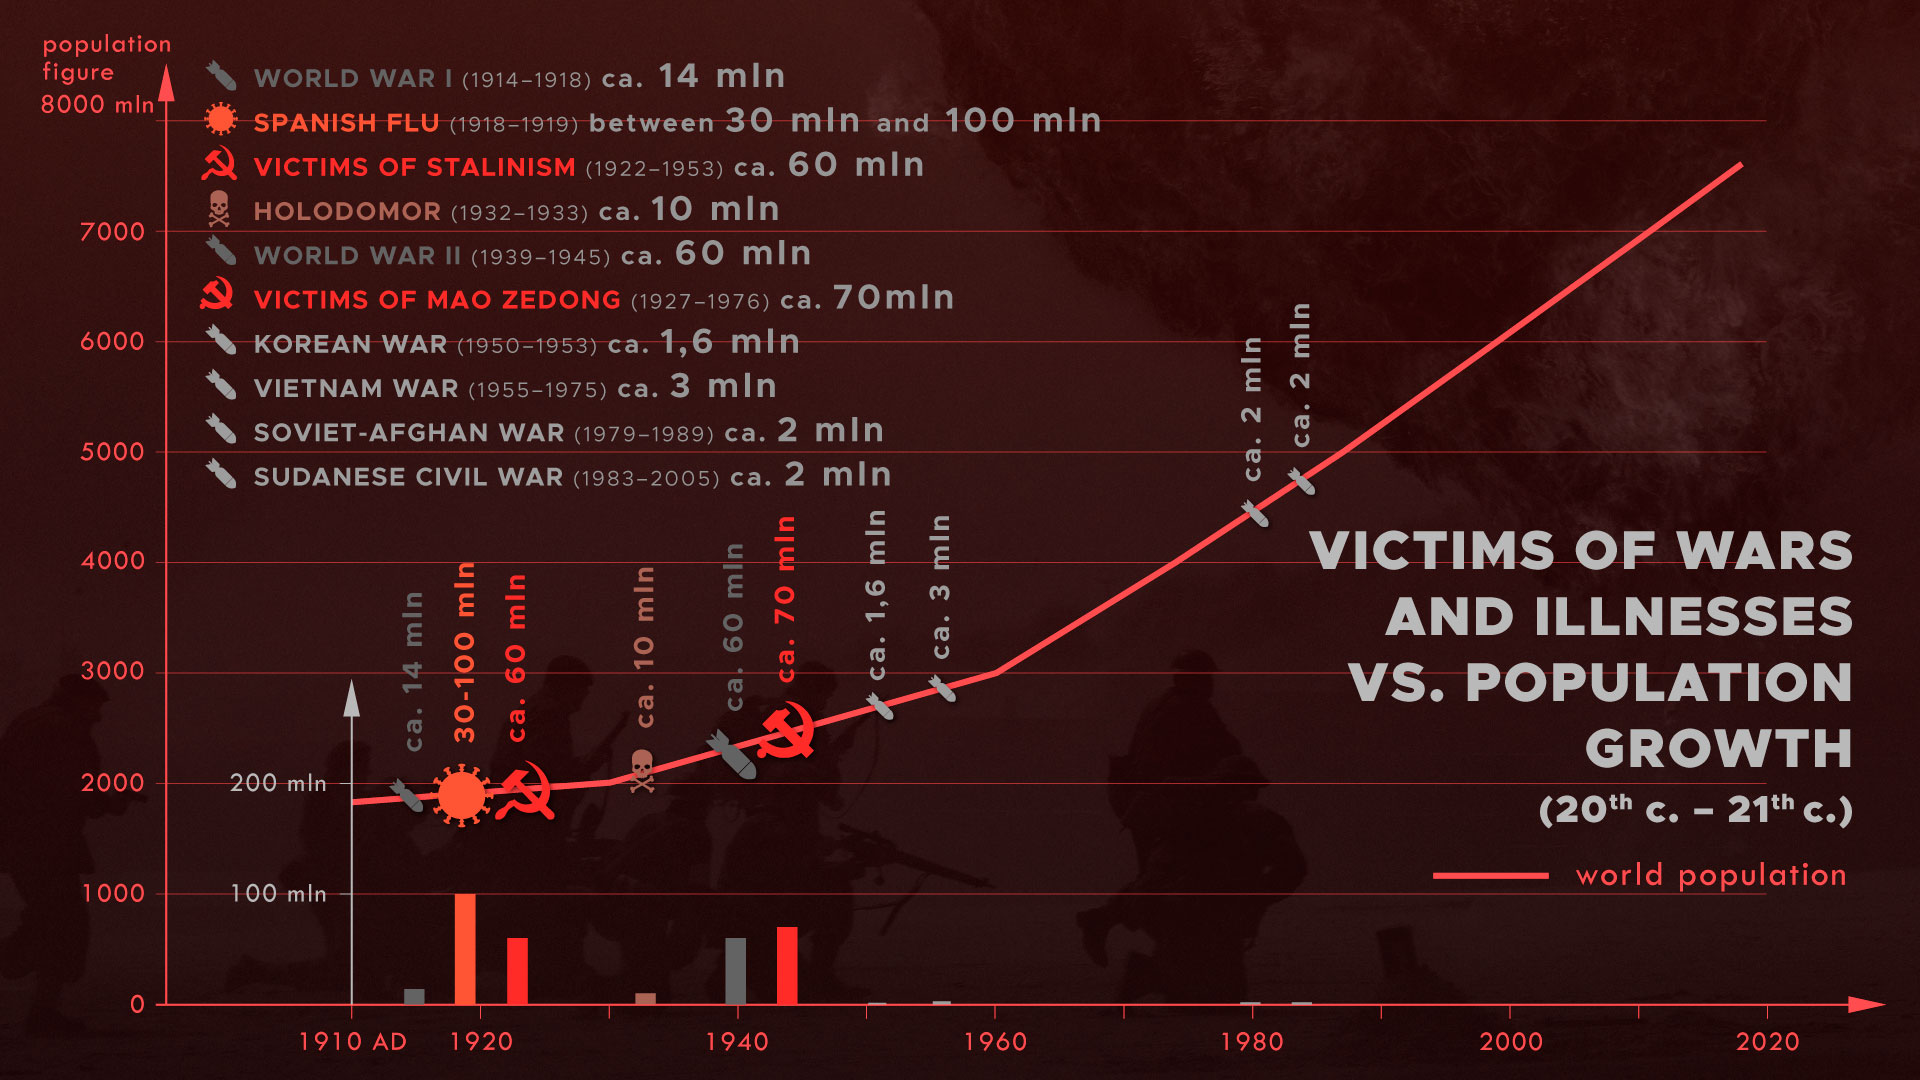
Spanish flu (1918–1919) – between 30 million and 100 million casualties
Here is a list of wars that have claimed enormous numbers of lives:
Thirty Years’ War (1618–1648 AD) – around 8 million casualties
Swedish Deluge (1655–1660 AD) – around 3 million casualties
Taiping Rebellion (1852–1864 AD) – around 10 million – 30 million casualties
American Civil War (1861–1865 AD) – around 1 million casualties
World War I (1914–1918) – around 14 million casualties
Holodomor (1921–1947) – around 10 million casualties
World War II (1939–1945) – around 60 million casualties
Stalinism victims (1922–1953) – around 60 million casualties
Mao Zedong victims (1927–1976) – around 70 million casualties
Vietnam War (1955–1975) – around 3 million casualties
Soviet-Afghan War (1979–1989) – around 2 million casualties
Korean War (1950–1953) – around 1,6 million casualties
Sudanese Civil War (1983–2005) – around 2 million casualties
I have listed the wars of the last 400 years, but people who know history know that there have been wars virtually since the very beginning. When we compare population growth with wars and epidemics, we can see the population growing at a rapid rate despite these events, so the argument of the evolutionists is wrong.
We can see that the population growth observed over the last 4,000 years allows us to approximate the starting date – the point in history at which the men appeared. My calculations show that the mathematical estimates suggesting that in 2369 BC there were only 8 people on Earth, confirm what the Bible says about human history. The evolutionists’ claim on 200,000 years of human history can just as well be perceived as a fairy tale, because even with minimal population growth today, there would be a looooooooooooooot more people on Earth.
Tymoteusz Chojecki
PhD in Mathematics
Article was published in Idź Pod Prąd year 18, nr 03-08 (188-193) March-August 2020
Bibliography
https://www.worldometers.info/world-population/
World population hits 6 billion. NBC News.com, 12 października 1999.
- Cambers, S. Sibley: Cambridge IGCSE Geography Coursebook. Cambridge University Press, II wydanie, 2015, s. 4
https://en.wikipedia.org/wiki/World_population
https://en.wikipedia.org/wiki/Estimates_of_historical_world_population#cite_note-26
http://www.endmemo.com/algebra/populationgrowth.php


